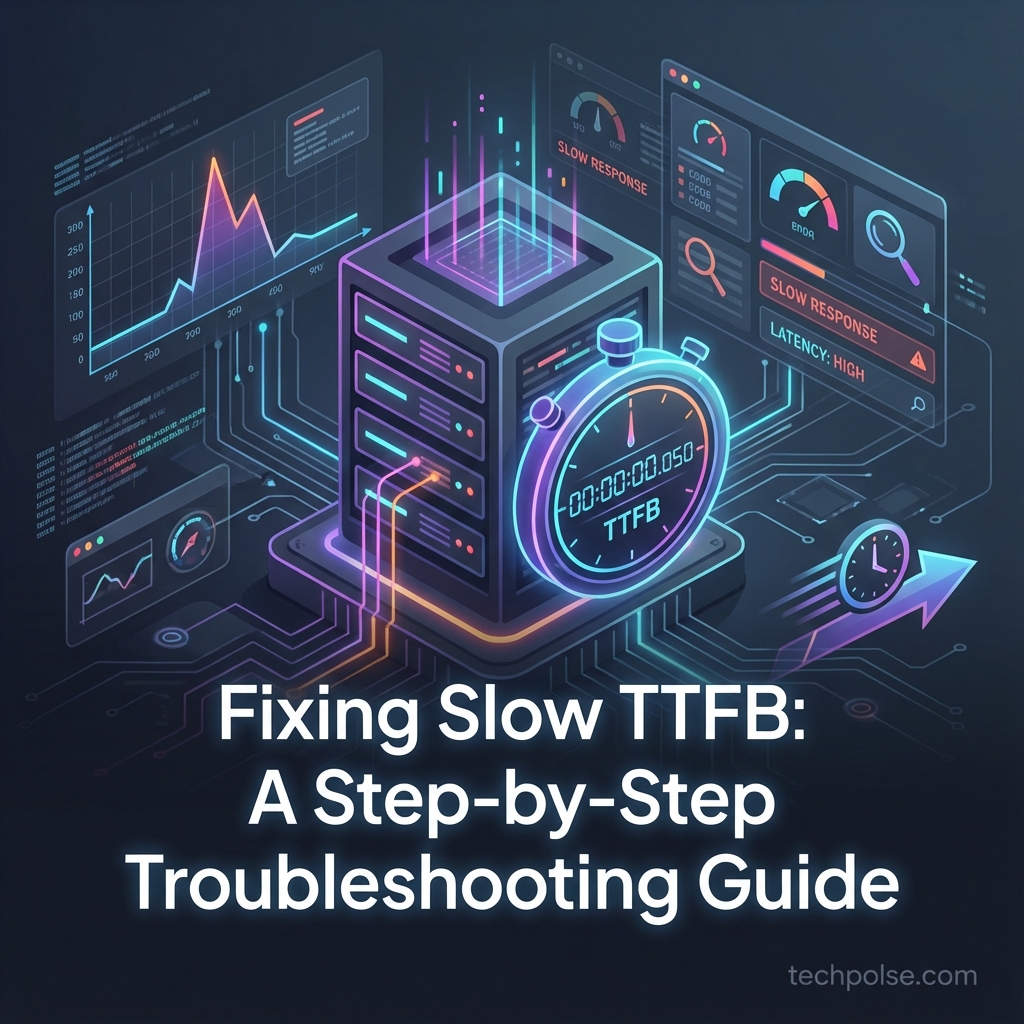
Time to First Byte (TTFB) measures how long a browser waits for the first byte of data from your server. Slow TTFB delays everything else—no content can appear until the server responds. While front-end optimization often gets attention, TTFB problems indicate server-side issues that front-end improvements cannot fix. This guide walks through a systematic troubleshooting process to identify and resolve TTFB problems on WordPress sites.
- Good TTFB is under 200ms for cached pages, under 600ms for dynamic pages
- Page caching is the most effective TTFB improvement for WordPress
- Database query issues often cause dramatic TTFB spikes
- Test from multiple locations to identify geographic or CDN issues
I. Understanding TTFB Components
TTFB includes multiple phases. Understanding each helps pinpoint where delays occur.
A. The TTFB Timeline
- DNS lookup: Time to resolve your domain name to an IP address. Usually 20-120ms.
- TCP connection: Time to establish a connection to the server. Depends on network distance.
- TLS negotiation: For HTTPS, time to complete secure handshake. Adds 50-100ms typically.
- Server processing: Time for WordPress to generate the response. This is where most problems occur.
- First byte transfer: Network time for initial response bytes to travel back to browser.
B. Acceptable TTFB Ranges
- Cached pages: Under 200ms is excellent. 200-400ms is acceptable.
- Dynamic pages (logged-in users): Under 600ms is good. Under 1 second is acceptable.
- Complex pages (search, filtered archives): Under 1 second is reasonable given query complexity.
II. Measuring TTFB Correctly
Accurate measurement requires understanding what tools report and testing under appropriate conditions.
A. Testing Tools
- Chrome DevTools: Network tab shows timing breakdown for each request. Look for "Waiting (TTFB)" on the document request.
- WebPageTest: Provides detailed waterfall with TTFB clearly labeled. Test from multiple locations.
- curl command: Run
curl -o /dev/null -w "TTFB: %{time_starttransfer}\n" https://yoursite.comfrom command line.
B. Testing Conditions
- Clear cache first: Test both cached and uncached responses. Cache misses show true server processing time.
- Test multiple pages: Homepage, single posts, category archives, and search pages may have different TTFB.
- Test multiple times: Single tests can be anomalies. Average multiple requests for accuracy.
- Test logged-in vs logged-out: Cached pages serve logged-out users; logged-in users often see uncached responses.
III. Page Caching: The Primary Fix
Page caching stores complete HTML output and serves it without running WordPress. This is the single most effective TTFB improvement.
A. How Page Caching Helps
- Bypasses WordPress: Cached pages can be served directly by Nginx or Apache without invoking PHP.
- Eliminates database queries: WordPress typically runs 50-200+ database queries per page. Caching eliminates all of them for cached requests.
- Dramatic improvement: Uncached WordPress pages taking 800ms might serve in 50ms when cached.
B. Verifying Cache Is Working
- Check response headers: Most caching plugins add headers like "X-Cache: HIT" or similar indicators.
- Compare cached vs uncached: Request once to prime cache, then request again. Large TTFB improvement confirms caching works.
- Test with cache bypass: Add a query parameter like ?nocache to force cache miss and see uncached TTFB.
IV. Database Performance Issues
When page caching cannot help (logged-in users, dynamic pages), database performance becomes critical.
A. Identifying Database Problems
- Query Monitor plugin: Shows all database queries per page with execution times. Look for slow queries (over 50ms).
- MySQL slow query log: Enable logging of queries taking over 1 second. Review logs for patterns.
- High query counts: Pages with 200+ queries may need optimization regardless of individual query speed.
B. Common Database Fixes
- Add missing indexes: Slow queries often lack proper indexes. Analyze slow queries and add indexes as needed.
- Optimize autoload options: WordPress loads all autoloaded options on every request. Audit and disable autoload for large, rarely-used options.
- Clean transients: Expired transients accumulate and slow option loading. Clean regularly.
- Remove post revisions: Excessive revisions bloat the posts table. Limit and periodically clean old revisions.
V. PHP Performance Issues
PHP execution time can dominate TTFB, especially with poorly-coded plugins or themes.
A. Diagnosing PHP Problems
- Plugin profiling: Disable plugins one by one while measuring TTFB. Dramatic improvement identifies problematic plugin.
- Theme switching: Temporarily switch to default theme. Large TTFB improvement points to theme issues.
- New Relic or Blackfire: Application performance monitoring reveals exactly where PHP time is spent.
B. PHP Optimization
- Enable OPcache: Eliminates PHP recompilation overhead. Verify it is enabled and has sufficient memory.
- Upgrade PHP version: PHP 8.x is significantly faster than PHP 7.x, which was faster than PHP 5.x.
- Remove slow plugins: Some plugins run expensive operations on every request. Replace with lighter alternatives.
VI. Server and Hosting Issues
Sometimes TTFB problems reflect hosting limitations rather than WordPress configuration.
A. Resource Constraints
- CPU limiting: Shared hosting may throttle CPU during traffic spikes. Monitor CPU usage during slow TTFB events.
- Memory exhaustion: Insufficient RAM causes swapping, dramatically slowing everything.
- Disk I/O bottlenecks: Slow disks impact database performance. SSDs are essential for acceptable performance.
B. Server Configuration
- Nginx vs Apache: Nginx is generally more efficient for static content and caching.
- HTTP/2: Enable HTTP/2 to reduce connection overhead for subsequent requests.
- Keep-alive: Enable keep-alive connections to avoid TCP handshake overhead for repeated requests.
VII. CDN Considerations
CDNs can help or hurt TTFB depending on configuration.
A. When CDN Helps
- Static assets: CSS, JavaScript, and images served from edge locations close to users.
- Full page caching: Some CDNs cache entire pages at the edge, eliminating round-trip to origin.
- Geographic distribution: Users far from your server see improvement from closer edge servers.
B. When CDN Hurts
- Cache misses: If CDN does not have cached copy, request goes to origin anyway plus CDN overhead.
- Misconfigured caching: CDN not caching pages adds latency without benefit.
- Origin location mismatch: CDN edge pulling from distant origin on every miss.
VIII. Troubleshooting Checklist
- Step 1: Measure TTFB for both cached and uncached pages. Note baseline values.
- Step 2: Verify page caching is working. Check for cache hit headers.
- Step 3: If uncached TTFB is high, install Query Monitor and check for slow database queries.
- Step 4: Disable plugins systematically to identify any causing slow execution.
- Step 5: Check OPcache status. Verify it is enabled and has adequate memory.
- Step 6: Review server resource usage (CPU, memory, disk I/O) during slow TTFB events.
- Step 7: Test from multiple geographic locations. Geographic TTFB differences indicate CDN or location issues.
- Step 8: Compare performance during peak vs off-peak times. Traffic-related slowdowns indicate resource limits.
IX. Conclusion
Slow TTFB undermines all other performance optimizations. A page that takes 2 seconds at the server cannot appear fast regardless of front-end optimization. The troubleshooting process should start with verifying page caching works, then move to database query analysis, PHP profiling, and server resource review. Most WordPress TTFB issues trace back to missing or broken page caching, slow database queries, or problematic plugins. Fixing the root cause rather than adding compensating measures produces sustainable improvements.
What was the root cause of your TTFB problems? Share your troubleshooting story!